The data set that I chose to analyze and create visuals based on, ‘Slave Sales 1775-1865’, is numeric, textual, and geographic in nature. The first two rows, state and county code, record the state (only southern states are included) and county in which a particular slave sale transaction took place. The third row is the date of the transaction, recorded only by the year,making the data set even narrower. Though the set is stated as recording data from 1775 to 1865, there is an outlying date of 1742, which could cause some difficulty in drawing conclusions about the data on the whole. There are also dates from 1771 to 1774.
The third row is the gender of the person who was sold, both male and female. In the fourth row, the age of the enslaved person is recorded in years. The next set of data is age in months, which turned out to be useless because all the entries were entered with zero. In the six row is the appraised value of each person. This row in particular figured largely in the direction I decided to go in within my analysis and visualization. The last two rows are textual information; skills and defects. The skills row describes a particular occupation that someone may bring to the table, whether it’s as a laborer, cook, or salesperson. The last row is a perceived or physical defect of a person. Like any commodity, enslaved persons are described in the context of being of workable value to a potential owner, therefore if someone is old, with child, or has a physical disability this is considered in the transaction entry.
This particular set of data was at first difficult to approach for a number of reasons. The first,and most obvious is certainly the volume of information contained in the set. At over 70,000 recorded entries, it was imperative to create a narrower focus. In my analysis I decided to cover the years 1810-1865 to create a more cohesive group of data to work with. In whittling down my data, the visualizations were made less messy and more understandable. The second difficulty that I was faced with was deciding exactly what I wanted to learn from this set. I knew I wanted to focus on women within the context of slavery, but I didn’t quite know how to approach making a connection from the information provided.
I finally decided to look at average appraised values of enslaved women from 1810-1865, from each state included in the data set. From this information, I was able to draw some interesting conclusions. A third difficulty was then deciding how to display the conclusions made in my analysis. After much experimentation, I found visualizations that I, as well as other viewers and historians, could easily interpret. The following will show the more detailed process of analysis, visualization, and its place within the wider historical context of enslaved women and enslaved people in general in the 19th century. This analysis also raised further research questions which I will also discuss.
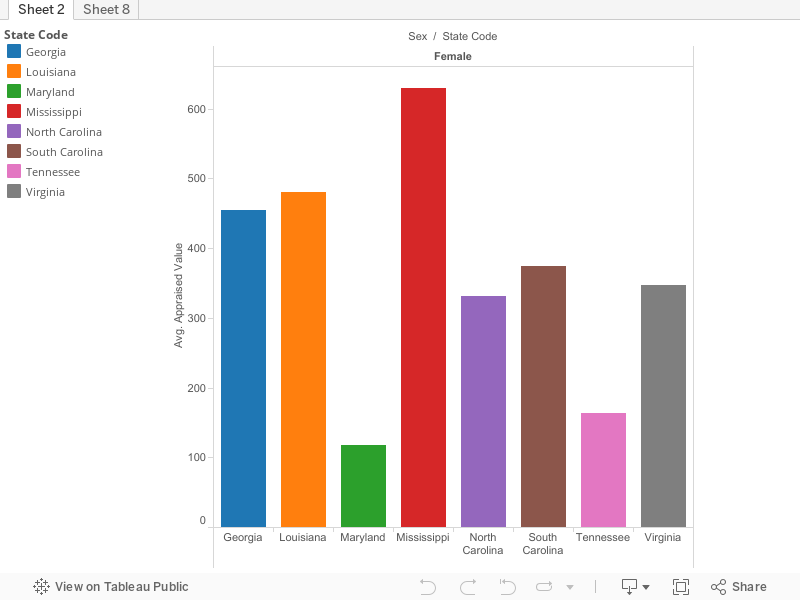
The first data visualization is a bar graph created with the data software,Tableau. This particular graph shows the average appraised value of enslaved women in each southern state . The columns are numeric monetary values based on the data entries, while each bar, or row represents entries from each state. Each state has a different color, to make it easier to distinguish the information provided. The appraised value is represented in increments of 50, also making it friendly for the user to see the change in each state. Each of the bars is interactive, and shows the real average appraised value of females in each state. The highest value is Mississippi with an average appraised value of $629.80 and the lowest appraised value is that of Maryland with $117.40. This influenced my thesis when analysing the cause and effect of slavery in each state and the rationale behind such a high price in Mississippi versus a significantly lower one in Maryland.
In trying to focus this particular direction with the average appraised value of women in slave states, I also created a map with a color scale corresponding to the average value in each state. This was an interesting value, but It didn’t have the effect that the bar graph had. In the graph, the varied averages were more clearly seen, and more importantly, the largest and smallest average values could be picked out more easily, which was the intent of my narrative. Though I didn’t chose the map, it did offer more insight in particular geographic questions that could lend itself to developing my larger thesis.
Another set that I also found interesting, but didn’t have the readability that the bar graph had, was a line chart that showed the progression of the average appraised value over the years 1810-1865. It was interesting to view the progression and especially to think of the potential causation of the spikes and depressions on the chart. I think that though I didn’t include this visualization within this analysis, It does serve to perform the same task as the map did-to enhance the overall thesis of my discoveries.
All in all, the value of the bar graph, though a seemingly simple sample taken from this large set of data, is that it set into motion the questions that I wished to answer in my argumentation portion of the analysis. Why did Mississppi have a higher average appraised value for women than any other southern state? Why was Maryland’s the lowest? What does this say about the variations within the institution of slavery in different regions or states within the South? Further, does geographic location play a large role in the discovery of these conclusions made from the numeric data included in the data set? The visualizations thus became the guide to the research of the historical context from which this information was gathered. This also influenced the choosing of my variants for my second data exploration and visualization.
My second visualization involves the exploration of enslaved women in the 19th century, but focuses on the skills row of the initial data set. This particular visualization is a symbol map with pie charts in each state containing the volume of certain skills such as laborers, midwives, cooks, and salespeople. At first, I was concerned that I wouldn’t necessarily gain any insight from this experimentation, but I was pleasantly surprised at what I did uncover. The particular information did contain some difficulties, most notably, that women didn’t have as many recorded skills at the men included in the data. This could be a matter of transcription or simply that this information was not thought of as important at the time it was first recorded 150-200 years ago.
After uncovering this information, I did come to conclusions that aided in both my first set of argumentation and even set into motion a new direction in my research and analysis. Each pie chart tells a varied story of the state, as well of the role of enslaved women in southern society on the whole. For some states, there is only one recorded women with a skill, most notably in Maryland and North Carolina, however the visualization had enough pertinent information in other states that I found I could draw potentially interesting conclusions from what was given.
The pie charts are brightly colored over a more austere map visual. This serves to emphasize the data being studied more than the particular geographic information provided. That said, the map isn’t just window dressing for the textual data at the center of this analysis, the geographic location could also bring forth interesting conclusions, as it did in the first visualization. As is the case with the bars on the first visualization, each piece of the pie is interactive, and when the user clicks on each, specific information from the data is given such as number of records pertaining to a particular skill in each state as well as the name of state and the given occupation represented by the pie piece. It is also important to note that certain occupations are grouped together. This includes cooks, pastry chefs, and bakers, nurses and nurse maids, and laborers and fieldhands.This is important to note because these grouped categories could potentially uncover variations in research that the data set cannot show.
This visualization both builds upon and adds new levels of conclusions to the ones made in the first data analysis and graphic representation. Taking a geographic visualization of the American south and layering textual information on it adds new dimensions to what eventually became the guiding thesis in my search for a connecting historical context for this data set that from the start seems to have no connecting factors. In the process of creating these and other visualizations, I found that the data in “Slave Sales 1775-1865” indeed has connections. By undertaking further research, I was able to make the connections more cohesive.
The process of actually deciding which data to use and which visualizations would present my findings in a way that was easy to understand. The process began with of course, looking at the data that was available to me and , based on that first glance, beginning to formulate questions inside my head of which relationships would be interesting to delve deeper into. To make the data more palatable I entered it into the Tableau program. From there I moved around some numbers, and initially hid the skills and defects rows, which I eventually chose to unhide explore further after creating my first visualizations.
After plugging my data into Tableau, I had some trouble at first making any sense of the data that was presented to me because of the size of the data set. There were so many entries over a large time period that it was difficult to even visualize relationships, at first. After mulling that problem over, I also had to see if the categories presented in the data could even be related in any way. Of course,after some tinkering I came to conclusions, but at first approaching and analyzing this set was certainly daunting.
Once I had my data set in Tableau, the fun part began. Of course I didn’t have a clear picture in my head of what my visualizations could look like, but experimentation was the best way of getting the creative process going. From further searching the initial data set, I decide that I wanted to focus on gender, specifically the correlation between average appraised value of female slaves. To narrow the findings, I decided to use the filter function available in the software to only include the years 1810 to 1865. I also used filters to remove the “male” and “null” categories from the data set so I could focus only on the “female” entries. Once I had the filters settled, I plugged in the information I wanted to use into the graphic box in the program, this included the gender, state code, and average appraised price ( which I found by modifying the information using a function on tableau).
After plugging in the pertinent information, I was able to select a visualization from the drop down list in the ‘marks’ box in tableau. From here I looked at several options before settling on the bar graph visualization. After tweaking the axes, I was able to customize the colors of the bars. I decided to make each a different color to make it easier to distinguish each state from the other. I made the graphs larger in size using the ‘marks’ box functions and also added labeling to show the average appraised value of each state over the bar.
This visualization eventually brought up questions immediately upon viewing it. For example, Mississippi has the highest average appraised value of $629.80. From this conclusion I was able to form some questions for research, and perhaps narrow my focus on enslaved women in this state in particular. Conversely, I could also explore why Maryland had the lowest average appraised value.
In the next visualization, I decided to take my analysis in a different direction from numeric information. As I mentioned before, I had initially taken out the skills category from the data set in an effort to make it more approachable and to further narrow my focus. I also decided that I wanted to use a map to focus my conclusions. I once again used the filter function and narrowed my years to 1810-1865. I than plugged in, once again, female entries, and filtered out the ‘male’ and ‘null’ categories.
To create a map visualization, I entered the skills, gender(female),and state code categories into the marks box, where it generated several visualizations in the drop down box. I ultimately chose the symbol map option, because I found that I could tell different stories on one graphic. I could represent a geographic and textual narrative all in one. The other graphic that I chose to use on the symbol map was a pie chart, showing the proportions of different skills among enslave females from 1810-1865. In choosing the details of the visualization,I decided to make the pie graph stand out as much as possible, therefore I made it colorful and eye-catching. I also made the pie graphs larger in size. I decided not to represent the number of each portion of the charts textually because It would make the map messier and more chaotic. Instead, each pie piece is interactive, and when clicked, tells the user the textual information available.
This visualization is interesting because it builds upon the geographic question I had, while also introducing new ones. The information included interesting information about women in the deep south versus those in the more southern states on the east coast. Women, in Mississippi and Louisiana, for example had a wider range of skills and occupations as opposed to Virginia and Maryland. What does this mean for the climate of slavery in the deep south? Does it reveal anything about the role of enslaved women that monographs and other scholarly sources do not? It was interesting to me that perhaps a visualization created through computer software from transcribed records could uncover a far more interesting narrative than a well-researched book, or journal entry. In making the choice to compare this particular data, I knew that, like the first analysis and graphic representation, I wanted to continue the central narrative of enslaved women, and perhaps find a connection between seemingly unconnected pieces of data.
At first, I was concerned because women included in the data set often have no skills recorded, which also tells a deeper story and also poses questions on its own. Slaves, of course, were considered property, and because of this non-status are recorded if they were cattle or some other commodity. Enslaved women, it seems, seem to have an even lower status, if that’s even possible, than male slaves. This question also figured largely in my thesis. Even though there is lack of information on the skills of enslaved women in the south, the data that is available begins to shed more light unto women who were being bought in the United States.

After evaluating what my analysis and graphic visualizations revealed,I knew that I had to dig deeper to uncover and perhaps validate my argumentation. My thesis was brought about by geographic evidence, and focuses on the deep south and in also explores in some detail, the state of Mississippi, where I uncovered my most interesting findings. With this in mind, I focused my research first on slavery in Mississippi before narrowing in on the issue of gender and its intersections with slavery. After an initial search, I came upon an article from the Mississippi Historical society specifically outlining the slave trade in the state and where the central markets of slave sales were located.
The article states that the rise of the English textile industry is the biggest catalyst for Mississippi’s slavery boom beginning in the 19th century(The Forks). Mississippi became the center of America’s cotton production. Cotton not only made the state money, but also led to an increase in population among whites, and also among enslaved blacks(Cotton in a Global Economy). Before the formative years of the early to mid-1800s, much of the slave labor in the United States had been concentrated near Virginia and around the Chesapeake Bay region. Although further exportation of African slaves was discontinued in 1807, Mississippi continued a profitable slave market system, most notably in the city of Natchez(Forks).
The trade in Mississippi was a booming market and as cotton prices ebbed and flowed, so did the prices of slaves in the state. In the 1820s and 30s, an adult male slave could easily fetch an average price of $400(Forks). Directly before the Civil War, the price of male slaves had risen to $800. Interestingly enough, this article also contained the average price of female slaves in antebellum Mississippi, and I was pleasantly surprised to see that my data analysis had yielded some historical results. It turns out the average price of a female slaves, recorded in the 1850s, was between $600 and $700 (Forks). It also shows that women were less valuable than men, which brings up even more questions about how they were viewed in southern society.
Female slaves, from first looking at my analysis, namely the data set available to me, seemed to have a lower status within their social strata, and given the social climate of the 19th century for all women, this is not surprising. However, the fact that these women were considered property in the eyes of the law and of their white masters made their experiences all the more horrifying. While many may view the only narrative of enslaved women in 19th century America was one of sexual exploitation and violence, I believe that as any marginalized group their story as far more rich and dynamic than is so often believed. I decided to focus on uncovering the whole narrative of female slaves from both of my visualizations and my data analysis. Especially the symbol map that I generated gave me new questions on just who these women were, especially in the deep south. While much of the data places enslaved women as servants, midwives, and cooks- in places such as Mississippi and Louisiana, they were seen in an assortment of other societal roles. Was this the result of variations of roles? Or, was the demand that cotton and other commodities placed on these areas required that female slaves take on new skills and occupations to make society and the economy more efficient?
To begin my exploration of these questions, I first wanted to focus on how enslaved women were perceived and what history tells us about their role in society and even the repercussions of these perceptions today. What I uncovered was definitely more than I expected. Within the context of slavery, women held different roles than they had in African societies. While the latter stressed motherhood, and childbirth and rearing in particular, as an aspect of life that garnered much societal respect, slavery saw childbirth as simply an economic transaction(Men,Women, and Gender). Women were of course expected to bear many children to the benefit of the master. Often after giving birth, women were expected to immediately return to their domestic or agricultural labor
This role of enslaved women, and the more widely studied notion of them being only sexual objects is often the only story told of these women,but as in any case, there was more to the story. African American women held very important roles within enslaved populations that gave them influence among their family systems. Families with children were often formed within matrilineal ties, because the mother’s family was often the one that remained on plantations long-term. In the day-to-day operations of the plantation, women often held two roles, domestic servants and field hands(Role of Women). Interestingly enough, more women worked in fields than men in the 19th century, mainly because of their longer lifespans(Women and Their Forgotten Role).Women often did not hold specialized skills, but some exceptions did exist, such as seamstresses or cooks. Slaves often were allowed to cook, craft , and plant for their own use, and women directed and supervised these activities(Forgotten).
My next line of research sought to answer the question as to why women in the south, especially in the deep south had such a variety of roles, as the symbol map seems to display. I began with the general question of the different roles that slaves in general played in the south besides cultivating and harvesting crops such as cotton. As had been discussed in class, industrialization was being touted in historical circles as a reason for the variation in skills and occupations for slaves in the 19th century,and this could be a very good example of why enslaved women, and enslaved people in general, held such varied positions, especially in the deep south .
Historian Daniel Littlefield of the University of South Carolina contends that as industry began to take hold in the United States , and certainly the south, that slavery took on a system almost based on factory work. Men, women, and children were often taken to the fields and lined up in a sort of assembly line of forced labor(The Varieties of Slave Labor). As cotton became more of a widely used product and less of a luxury item, due to mechanization, the demand for a labor force also grew. Mills in New England, for example were dependent on the cotton cultivated in the South, and therefore the North profited from the economic institution of the south(Slaves:The Capital).
Littlefield also contends that instead of being more varied, slavery in the 19th century was more dimensional than in the colonial era, which runs contrary to the outcomes of my analysis and visualizations. Certainly by the 1850s, and the peak of industrialization, slaves were not only working in cotton or tobacco fields, but in textile mills, laundries, and steel foundries. And during this time over 500 thousand slaves were residing in southern cities rather than rural plantations(Digital History). Slaves were also involved in the production and construction of infrastructure such as building roads and bridges(Digital). These observations only serve to show the complexity of the institution on the whole, because slavery was thought of as a backwards system, this evidence points to a more defined and organized economy(History). Indeed slavery was certainly a large catalyst in the economic growth of the United States as a global power, even though historians may say that it was essentially an antiquated, backwoods rural economic system(Capital).
From my research I came to many conclusions and also had new questions. I learned that enslaved women held important roles within their own social circles, beyond their role of producing more children to further elevate the economic gains of their masters or become victims of sexual abuse and exploitation. It was also satisfying to find that my analysis and bar graph visualization proved conclusive from the research I conducted, though the matter of why average appraised prices were what they were still perplexes me on some levels. In the matter of variation of roles and skills that slaves held, I thought that the idea of industrialization as a catalyst for slaves taking on more roles in society than just farming or within the domestic sphere. I also think that it brings new opportunities for other narratives to be told. Perhaps an enslaved worker in a foundry or textile mill could be a new exploration for historians exploring racial, social, labor and economic history. Who knows the possibilities that are possible from these new directions in scholarly research.
When I was first grappling with the content of the “Slave Sales 1775-1865”, it was definitely daunting. Though my research and writing skills had been honed in my undergraduate career, dealing with textual,geographic, and numeric data within a spreadsheet was an entirely new frontier for me. With the number of entries, it was even more challenging visualizing how to create a cohesive picture of historical significance from transcription.Of course, with my analysis and with further research, I was able to draw some conclusions and make some valuable connections between data and historical narrative, but from my explorations even more questions arose.
When I first saw the data set, I knew that I wanted to focus on women who were enslaved, because it had been a central interest in my academic career. Of course coming to terms with technology and all that goes with this technology, it was difficult coming from a background that was so often based on studying the accomplishments,lives, and struggles of individuals, to apply what I had learned to a study of a large group of data and individuals. However, I soon learned that data sets can generate new dialogues within gender history. Though some questions still remain. I found that women were far more dynamic than is often thought in academic and non-academic discussion, but I found that there wasn’t much of a new narrative.
Some further Questions:
-Could digital history reveal more about the domestic roles slave women held?
-What are the wider implications of enslaved women as heads of families? What influence does it hold in today’s world?
-Were women present in the textile mills and other industry or was this purely the sphere of men and boys?
-Though slave narratives are widely available, could a digital history project be created that tells of women in an industrial capacity or in a an occupation separate from field work?
Building off my research on industrialization, I believe that a preliminary survey of the Industrial revolution in the United States could have been more helpful in understanding the evolution of slavery from on economic system to another. I think that a re-introduction to how factories operated specifically in the 1850s and 1860s would be helpful in viewing or trying to understand how field work transitioned into a sort of “assembly line”form of production.
I believe that a way to research these questions would be to delve deeper into first-hand accounts from former slaves, from transcription or even available audio. Of course traditional research such through monographs or scholarly journals could also yield some evidence that could answer these new questions.
Another possible route of research could be from approaching the data set in other ways. When I began my analysis and was choosing a direction to go in with research and visualization there were many questions that circulated through my mind. Although I chose to focus on gender and slavery, there were other interesting directions I could have taken. Within my data set, though there wasn’t a great variation in the subject matter covered, there were several research questions that could have been generated. An example of this was the age row, in which the average age of slaves being sold in relation to say, their average appraised price could have been examined. From this I could have made a map showing the average age of both female and male slaves in each southern state. Another part of relationship I could have examined would be age and skill set.Some research questions that could be prompted from these relationships are:
-What was the average age of a slave sold in the period from 1810-1865?
-Were children more desirable than adults at auctions? What criteria were desirable to slaveowners at the time?
-How did slave markets operate on the whole? Who were the people who operated these markets?
-Was there any real basis for the relationship between price, gender, and age?
-Was their an evolution in these relationships in the early years vs. the years directly preceding the Civil War?
-Connected to the above question, and a question of general context-How did the Civil War affect the buying and selling of slaves in the south?
All in all, I think performing my research on the Civil War in general would probably have been helpful, although at first I thought it went beyond the scope of my analysis and research. I think it's could have been interesting to use the war as a sort of closing point to my research as falling action of slavery, where the Industrial Revolution had been a sort of climax in the slavery narrative. As I am an expert on the Civil War or the Industrial Revolution, further research on both of these subjects and their connections would only add to this quantitative approach to history. However, from my background as a cultural historian, so focused on the story of the individual, I was hesitant to use such widely studied aspects of American history.
This brings another path to research that I would probably not have considered before. Though digital history is a relatively new form of research and historical enquiry, the insights it brings to narratives is definitely exciting,especially coming from a very traditional historical background. I think if I were to approach this project again, I would have definitely chosen to use more quantitative data. I think that it by further building on my preliminary data by searching for more supplementary information, I could have created more detailed analysis and visualizations and better build upon my initial research. Perhaps data exists that tells more of the experience of the enslaved during the 19th century. Perhaps names, birthplaces, and other more personal details create something deeper than the information I had to work with from the “Slave Sales” data set. I think that my want for a more personal account of this chapter in American history left much to be desired of quantitative information in a certain sense. But digital history has also become for me more personal because of the research questions it poses. This, I think, is the most useful aspect of this medium.
Works Cited
Barnett, Jim and H. Clark Burkett.“The Forks of the Road Slave Market at Natchez”.Mississippi History Now.accessed May 8, 2016.http://mshistorynow.mdah.state.ms.us/articles/47/the-forks-of-the-road-slave-market-at-natchez.
Dattel Eugene R. “Cotton in a Global Economy:Mississippi (1800-1860). Mississippi History Now, accessed May
8,2016,http://mshistorynow.mdah.state.ms.us/articles/161/cotton-in-a-global-economy-mississippi-1800-1860.
Hallam, Jennifer. “Slavery and the Making of America”.PBS, accessed May 8,2016,http://www.pbs.org/wnet/slavery/experience/gender/history.html.
Littlefield, Daniel.”The Varieties of Slave Labor”. International Humanities Center, accessed May 8,2016.http://nationalhumanitiescenter.org/tserve/freedom/1609-1865/essays/slavelabor.htm
Ott, Julia. “Slaves: The Capital that Made Capitalism”.Public Seminar, accessed May 8,2016.http://www.publicseminar.org/2014/04/slavery-the-capital-that-made-capitalism/#.VzP70CMrK00
Sadler, Nigel. “Women and their Forgotten Role in Slavery”. Sands of Time Consultancy,accessed May 8, 2016.www.sandsoftimeconsultancy.com/.../WomenandtheirforgottenroleinSlaverysynopsis
“Slave Labor”. Digital History, accessed May 8, 2016.http://www.digitalhistory.uh.edu/disp_textbook.cfm?smtid=2&psid=457
“The Role of Women is Slave Communities”. Gettysburg.edu, accessed May 8,2016.http://www3.gettysburg.edu/~tshannon/hist106web/Slave%20Communities/atlantic_world/gender.htm