Immigration as Societal Change
By
John Cassidy
Anti immigration sentiment in the United States and elsewhere often revolves around the same argument, this argument being that the new arrivals will bring about a major demographic shift that will ultimately result in a fundamentally changed society which comes across as alarmist but the question remains if this thesis is mathematically possible. This idea has also ingrained itself into the traditional narrative of America in the nineteenth century, prior to this period the immigration to the United States was largely centered around the arrivals from the Protestant areas of Europe as well as the non Catholic populations of Africa used as slave labor. But at the second half of the nineteenth century arrivals from the Catholic areas of Europe began arriving in mass to the United States and with this shift in immigration rhetoric about an impending transformation in American society inevitably followed. Using the Sate of New York as a test case as it was a major influx point for immigration in the nineteenth century this paper will use data and calculations from three sources from the time period to determine the actual demographic shifts during the era. These sources are the 1860 and 1880 censuses of the City of Albany which provide data on the country of origin for citizens and the NY Religion by County data that displays the number of churches various religious denominations in the various counties of New York from 1850 to 1890. Using this data this paper will answer some of the key questions that will either directly prove or disprove the overall assertion, first to what extent did immigrant populations from the more Catholic locations of Europe increase in the second half of the nineteenth century, second was their expansion concentrated in either a select few urban areas or was it a more statewide phenomenon expanding into the rural counties, and last by the time the century had come to a close how had the overall population percentages been affected and more to the point did a new majority emerge from this population influx. Finally while it should go without saying this paper is not about the ethical or social questions around immigration of either the nineteenth century or today and is merely a demonstration of how the use of numerical data can support or dismiss an argument.
The first two data sets the censuses provide largely the same form of data, by grouping the national origins of the persons described in the documents into either Catholic or Protestant countries a rough idea of how immigration affected religious representation can be determined. Before going into the how the data impacts the questions around immigration it is worth noting how the data sets were manipulated to create the sheets that will be referenced in the coming paragraphs. For both census sets the original excel files were put into the program Tableau where the two fields used were the total number of participants and their national origins. The national origins were then divided into four categories as previously stated with the various counties of origin for immigrants being grouped along religious lines. To determine religious lines there have to be assumptions based on national origin, for the category of Catholic countries the southern European states such as Spain or France with Italian areas included but as of the 1860 census Italy was not yet a unified country, included as well is the main source for both censuses Ireland excluding Northern Ireland whose counties contain Protestant majorities, the Northern European states like England, Holland, and Scandinavia were classified as the Protestant immigrant group. Then each of the groups was divided by the total population and the results molded into a pie graph creating the sheets for both the 1860 and 1880 censuses. The value of the pie graphs is that they show portions easily and also because of how the calculations were done also show the percentages when the cursor is placed over the various pieces. The first thing to note about the data sets is how while a previous sentence described three categories there are four in each of the charts. This forth outlier contains the various states that would eventually (in the 1860 and a lesser extent the 1880 census) unite into the modern country of Germany, the reason behind the separation of Germany from the rest of the data is that Germany contains large populations of both Catholic’s and Protestant’s throughout the sub states which makes accurately dividing them along religious lines unrealistic within the given timeframe. Additionally while this does not affect the statistical analysis of the paper it should be stated that for the category of natives anyone born in the United States is counted meaning that these people were native to America not either Albany or New York specifically. Even with any potential German Catholic’s excluded however the percentages still heavily favor Catholic immigration with 23.13% representation in 1860 as opposed to Protestantism’s 4.56% and 15.36% in 1880 to 4.59%. While the percentage shrank between the two data points it is important to note that the raw number of people increased heavily between the two decades with 921 individuals transcribed in 1860 and 23,904 in 1880 which can be attributed to better record keeping and not a twenty three fold increase in population. What this data also shows is despite the focus given to immigration during the period Albany’s population as seen in the census was still overwhelmingly native born although how the children of immigrants factor in to the population will be addressed later.
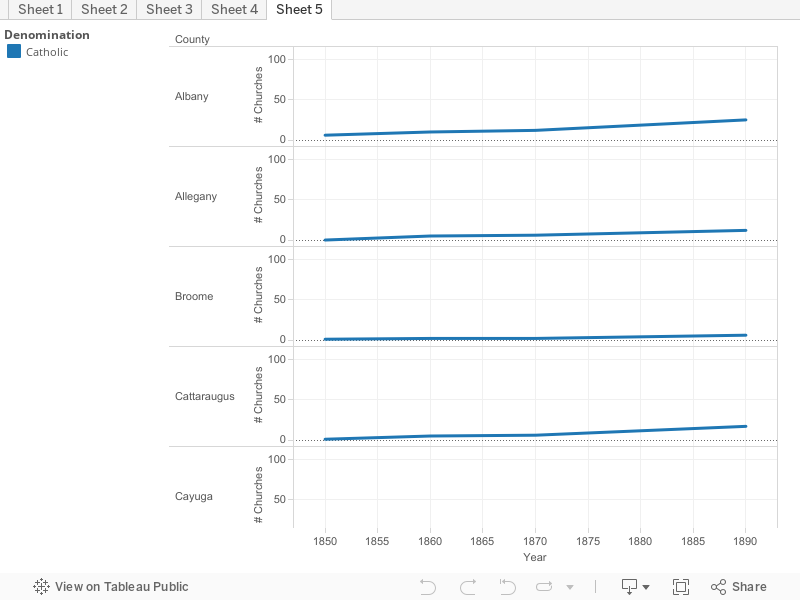
The data set that differs from the census data is the recording of the number of churches data that gives the number of religious institutions in the State between 1850 and 1890 with divisions created along denomination. For this data the grouping was largely unnecessary as the required dividing lines already existed and the presentation of the data was the primary focus. For this five sheets were made around the growth of Catholicism as both a percentage and as a raw number with the key factor to note being that for this data set only the number of churches were measured and not congregation size leaving these numbers as an estimate of the populations religious orientation rather than a concrete measurement. The first sheet breaks down the data to focus solely on Catholic churches and goes county by county to show how new churches were constructed as a percentage over this forty year period, as an example Albany County in 1890 saw a 108.3% increase in Catholic churches while in real numbers the county went from twelve churches in 1870 to twenty five in 1890 which reflects an increasing Catholic population within the county otherwise such construction would be unwarranted. This was expressed along with sheet number five as a series of line graphs, one for each county showing percentages with no coloration required due to the fragmentation of the data along county lines. Sheet two broadens the view and shows the raw numerical increase in churches across the state over the four decades this chart shows how both Catholic as well as religious institutions across New York increased in the period and also gives a quick glance as to how large a portion each denomination was able to capture with this view giving the observer the opportunity to look at the topic without the potentially misleading ability of percentages. Instead of a line graph sheet two used a variation of a bar graph that used numbers of churches as its axis and uses color coding to differentiate the various faiths with its size determined by the number of churches it possessed and not any sort of percentage. The sheet assigned the colors randomly and it seemed unimportant to alter the assigned scheme, blue was used for Catholicism and it was sufficiently large to not require special differentiation. Sheet three breaks down the numbers seen on sheet two into a percentage with Catholicism making up 4.26% of churches in 1850 and 11.25% in 1890, the advantage offered by this view is that one can rapidly look at the numerical winners and losers of the period such as again Catholicism or the Episcopal church which rose to 10.61% of total churches in 1890 as opposed to its starting point of 6.75% in 1850. These percentages were placed into a line graph with the percentage used as an axis maxing out at forty percent as the largest church the Methodists peaked at just over thirty two percent, the lines are once again color coded using the same set as the other sheets and also having a quick color guide should the viewer need it. Sheet four also gives percentage data this time detailing how various faiths increased or decreased between 1850 to 1870 and 1870 to 1890 by showing the number of churches as an increase or decrease from the previous data point for example if an institution had 20% more buildings in 1870 than in 1850 then the chart would read 20% on the 1870 point. What this offers is to detail how even as most of these organizations were expanding which churches were growing above or bellow the average rate. For Catholicism the increase looks deceptively like a drop off between 1850 and 1870 because the chart reads a 104.5% jump in 1850 and only a 26.4% increase by 1870 in terms of raw number however a 20% increase on top of a 104% hike is still enormous growth over just two decades and what makes the numbers even more impressive is that between 1870 and 1890 the rate once again spikes showing a 97.2% positive meaning that at no point over this four decade time span did construction of new Catholic churches decreases and in fact the church maintained at least double digit growth for forty years which any former business major can tell you is staggering. What is also apparent by this pattern of construction is that if the church commissioned so many new buildings there must have been demand in terms of increasing congregations to justify the expense in land acquisitions and construction to bring about this physical growth as basic logic will state that no organization will construct buildings to lay empty on that kind of scale and while it is doubtful that the majority of these projects were on the scale of a structure like New York’s St. Patrick’s Cathedral the fact remains that to grow their structural presence in an area at such a scale there must be a growth in followers to support it. The final observation from sheet four is that by the time it gets to the 1870 to 1890 gap Catholicism in terms of growth has risen to the top of the list beating out its nearest competitors by over twenty percent and while the data available cannot speak to the growth of congregation size the comparison of construction during the time period shows that as the nineteenth century was coming to a close Catholicism was expanding its physical capacity and holdings at rates beyond other faiths in New York meaning that if this pattern could be sustained then as time passed Catholicism would continue becoming a progressively larger portion of not just religious buildings in New York but the population as a whole. The final sheet, sheet 5 on the first data set takes the overall numbers seen on the other sheets and divides them into the individual counties of New York to show growth or loss for each area, for the purposes of this paper other churches were excluded from this break down of the state to show how Catholicism either grew or shrank between 1850 and 1890. The data is displayed in much the same way as sheet number one but rather than showing a county by county breakdown as a percentage sheet five displays the straight numbers of Catholic churches with once again there being no real need for color differentiation and are displayed with a numeric axis. The results are overwhelmingly in support of growth while the lines are somewhat skewed by the major urban counties like New York, Kings, and Eire pushing the range beyond most of the smaller counties making the lines appear close to the bottom of the graph. Even with the distortion caused by the major population centers in the smaller counties of New York the general trend heavily favors growth. This defeats a potential critique of some of the large picture sheets seen in the data set, that the growth seen in the data could just be the result of major growth in a select few urban areas with large immigrant populations, the growth across the vast majority of counties shows that even beyond the areas that traditionally hold the attention of those viewing nineteenth century immigration there was growth of Catholic institutions. This ranges from an increase in churches in areas that had existing Catholic structures to counties that in 1850 had no Catholic churches gaining them by either 1870 or 1890. With the already established ties between the Catholic Church and late nineteenth century immigration this growth can represent immigrant populations moving beyond the major influx centers and into the more rural areas of the state because as stated with chart four the expansion of physical buildings is a logical sign of expansion of followers.
With the data sets and what they can convey established the time has come to return to the original three questions, starting with the growth of the immigrant population. With the 1860 census we see Catholic immigrants represent just over twenty three percent of the sample population which dwarfs the approximately four and one half percent that fall into the category of Protestant immigrants with both groups being dwarfed by the seventy three percent of native born persons. Two decades later we see an evolution in the numbers, excluding the twelve percent made up by German immigrants wee see Catholic immigrants at fifteen and one third percent of the sample size with Protestant immigrants at four and one half percent leaving at natives at a hair over sixty seven percent. This is where the analysis of data becomes critical, if one simply reads the numbers it appears that the target population is decreasing but basic number crunching fails to take in to account several factors, first that the 1880 census is an exponentially larger sample size as both the overall population of Albany increased and the census was more effectively taken. Next that while it is necessary to segregate the German population because of the aforementioned religious complexity of that nation if even half of the German immigrants of the period come from Catholic areas of Germany which is a more than reasonable assumption then the percentage goes up to twenty one percent. If three quarters of the German immigrant population was Catholic which is easily within the possibility sphere then the overall Catholic population hits twenty four percent which climbs the stats to within margin of error of the 1860 census in terms of percentage. Finally what one can determine is that naturally the immigrants who arrived in Albany by the time of the 1860 census would have had children over the course of twenty years and said children would be born in Albany so when counted in the 1880 census would fall into the native born category so as long as the birth rate in Catholic immigrants was above two per family which is another safe assumption then the Catholic percentage of the native population would rise so even as immigration either stayed flat or decreased the areas Catholic population could continuously increase which in short is a demonstration of a ripple effect of immigration. Because religion is not a measured category on the census it is impossible with the data available to determine the extent of this ripple effect but when coupled with the growth of Catholic churches from twelve to twenty five between 1870 and 1890 it becomes clear that is must have been significant as immigration alone cannot cover the number of churches more than doubling in a twenty year period. What all the data shows is that the answer to question one did the Catholic population increase significantly in the period is unsurprisingly yes.
With the answer to question one in hand the next step is to address question number two, did this expanding Catholic population remain in a select few areas or did they move out into the more rural areas of the state. For this question the census data has no real value as it does not move beyond the city of Albany and as previously stated does not deal with religious affiliation. This leaves the church data which with the qualifications already stated about lack of parish size still can offer insight into how various religions expanded across New York. The first step is a quick examination of both tables one and five, both tables show increases as both a percentage and strictly numerically. But this question deals with the expansion or lack of within the less urban areas of the state so the areas around New York City, Albany, Syracuse, Rochester, and Buffalo do not really factor into the first part of this question. Looking past these cities respective counties the trend remains solidly in favor of expansion with only Hamilton County lacking a Catholic church by 1890 with the vast majority of counties, even ones that did not have a Catholic church in 1850, having multiple churches by the end of the century. With it established that the counties of New York rural and urban alike saw growth in Catholic churches in the second half of the nineteenth century the assumption that the growth was concentrated in the urban areas is not totally unfounded in reality as the areas that saw the most numeric growth were naturally the major population centers with New York City reigning supreme rising from nineteen to one hundred and eight churches. The percentages tell another story with larger jumps in some of the less populated counties of the state but as with all percentage based examinations this can be deceiving as a zero to five increase looks much more impressive percentage wise than a ten to twenty jump. To summarize while the largest real growth was seen in the urban centers of New York the expansion of the church can be seen across the state so the perception that the immigrant population was isolated to the city is false, this is isolated to New York alone so for a more national answer additional data would be required.
The final question is essentially the big picture, while the previous questions have shown that the Catholic immigrant population expanded during the period and that Catholicism expanded in both size and area the real question is how far this expansion went by the time the nineteenth century came to a close? The first part of the equation population has largely been addressed by question one, while the immigration of the period did shift the scales the native portion of the population held the majority by a comfortable margin. While this lead was eroding as time went to what extent is difficult to determine, a way to determine the shift would be to take the immigrant percentage in 1860 use the birth rate to find what portion of the native percentage was Catholic by 1880 but with existing data this is impossible for two reasons, first that the 1860 census is such a small portion of Albany’s population to make calculating numbers from it into the larger 1880 census something of a lost cause without additional information and second that the birthrate information for the subsets of Albany’s population is not included in either census and would require additional research and data collection. To view the state wide expansion all that is really required is sheet three of the churches by county data, in 1850 Catholicism possessed 4.26% of churches in the state and forty years later had climbed to 11.25%. As previously stated this was during an era of general expansion across the various branches of Christianity in the state so for a single sect to nearly triple in size is impressive. Additionally in 1850 there were five churches larger than Catholicism in order, Dutch Reformed, Episcopal, Presbyterian, Baptist, and Methodist. By 1890 only Presbyterian, Baptist, and Methodist remained larger and over the forty year data range all three of these institutions lost percentage points with two out of the three Baptists and Presbyterian’s losing five and three percent respectively and the Methodists largely holding fast with only a .2% loss over the forty years but had seen a three percentage drop from where they were in 1860 losing the gains they had made from 1850 to 1860. There can be only two explanations for this shift in religious representation either that the existing population shifted religious affiliations which is not the case or that the rate of immigration and the subsequent American born families of said immigrants allowed certain religions to gain representation, other winners included Judaism which went from having no recorded representation in 1850 to .89% by 1890 which could only come from immigration as their was no existing base for native birthrates to build on and the Lutheran faith practiced by Protestant German immigrants jumped from just over two to four and one quarter percent by the end of the century showing that even among Protestant faiths their was an increasing presence of immigrants as the nineteenth century progressed. To come back around while there were immense gains by the turn of the century Catholicism ended the century at just over eleven percent of overall religious buildings and no matter how much of a gain that is over the previous percentage it is still a long way from a majority of a population. So for question number three with the information available from either the city of Albany or the Churches by County it is clear that the target populations boom in size was insufficient to secure a majority.
With all three questions answered the numbers indicate several truths about nineteenth century immigration, first it shows that unlike the previous waves of immigration the mid to late nineteenth century immigrants began arriving from the Catholic portions of Europe placing different ethnic groups into the United States and in significant numbers. Next it shows that with the building of churches as an indicator that these Catholic populations went beyond the assumed urban centers and established a presence across the state. Finally however it shows that for all the demographic shifts of the nineteenth century anti immigrant fears of the United States being dominated by either these new ethnic groups or the Catholic Church were unfounded as the traditional native population maintained its majority and on a national level a Catholic would not hold the presidency until John F. Kennedy’s election in 1960. Despite the findings shown in this paper the questions around immigration are thoroughly complicated to the extent that examining a single city or even a single state does not fully answer the question of cultural evolution via immigration. While the reader can find large numbers of immigrants from Catholic Europe in New York an examination of other states particularly more land locked states would yield entirely different data. It is also from such differences in dispersion of immigrants that other cultural differences arise and can be one of the principle reasons behind the differences in the cultures of the different regions of the United States. Because of America’s unique development all regions of the United States have influences from various outside cultures, which groups settled which region en masse helped shape the states for decades to come. Regardless because of New York’s consistent place as a major economic and population center how New York’s culture was shaped is a vital piece of America’s development in the nineteenth and early twentieth centuries. Finally as America’s population shifts out of the Northeast to the South and West the immigration patterns into the South will become major forces in shaping the culture of America in the twenty first century. With the limitations of the existing data sets apparent how would a more detailed examination of the topic find the answers not available at this time. For question number one the obvious step would be to acquire the census data for New York State as a whole rather than just the city of Albany for a more complete picture of immigration during the period, to go even further one could take this data and compare it to the census on a national level. An additional research path would be to look up which German areas were dominated by which faith, as previously stated Germany was not as religiously unified as a country like the Netherlands or Italy and due to the limited time frame the most effective option was to exclude the various areas of Germany seen in both censuses and for a more detailed paper this would need to be rectified, while time consuming this would have to be accomplished by using the German regions listed in the data and researching each ones religious background. Question two would require largely the same steps as number one but the only additional detail required would be parish size, as stated in the rundown on the churches expansion the data set accounts for only the number of churches not how many persons attended each one so to truly show how the Catholic population of New York concentrated these numbers would be invaluable, to find this data the best source would probably be the church itself which could be complicated and has no guarantees of success. Another step for question two would be to acquire a second data set to reinforce the first, for the first two data sets the US census is a sufficiently official process to stand on its own but for the church data it would be useful to have supporting documents. Question three was difficult to answer with the available information so additional sources would be vital to a more through answer to the demographic shifts in both the Albany area and the overall state, first off if information about birthrates in immigrant groups could be established the answer given in this paper would carry significantly more weight. Next the statewide census rather than just Albany would be needed for a more complete answer and finally the immigration data from institutions such as Ellis Island could provide missing details such as the average age of the immigrant populations more detail on the origins of New York’s new residents. Finally for all the questions if the paper wanted to see the long lasting effects, the most obvious source for more modern data would be later censuses beyond the nineteenth century up to perhaps the 1920’s to see more complete after effects.
The technological advances brought on by computing have rewritten how virtually all academic work is done, while the use of this tech started out and is most apparent in the sciences this is another reason that the issue addressed in this paper paints an incomplete picture, while religion is a useful dividing line for populations and can be a major force in shaping the actions on the individual as well as societal level there are numerous other factors that dictate the actions that arise from immigrant populations but this is a prime example of how the examination of historical events numerically has limitations. When conceiving this project one of the attractive aspects of using religious affiliations and national origins is that they were recorded in the data sets on an individual level or county level for the churches and can thus be divided into percentages or portion which makes for effective numeric comparisons. If other pieces of data such as political party affiliation were available then further understanding of an area could be extracted from the data sets. This again runs into the more problematic piece of numeric analysis in that the agency of the individual or individuals involved must largely be ignored but while this is a problem for digital history what is also true is that this is a reality for any type of macro analysis historic or otherwise because sometimes in order to see the whole picture certain smaller details must be ignored and vice versa. Beyond generalizing another issue not directly seen in this piece is that a great number of details around historic events that cannot be represented numerically, for the study of any history of an individual there is often little comparison work to be done at least in regards to numeric comparison with an exception being those persons with statistics attached to their accomplishments such as athletes but for individuals who work in fields with less apparent success fail states these statistics can be harder to come by unless the researcher is willing to extrapolate to some degree such as looking at a how many bills a president vetoed or other things of that nature. An unpleasant reality is that no matter how capable or advanced a new technology may be there is no such thing as a perfect research method and traditional methods have yet to be made obsolete in the digital age and until such time as all information is available digitally this will remain the case. Limited or not the view of issues such as immigration provided by numeric analysis expedited by the digitization of historical information is extremely valuable for macro analysis and historians have proved more than capable of examining the minute details of the past so while it is important to remember the limitations of this type of analysis its use should not be forsaken as each research method contains its own positives and negatives.