Author: Maeve Kane
Tableau walkthrough – Intro to Digital History
Open Tableau and select Connect>Text File. Find your .csv file where you downloaded it (desktop or downloads, probably)
State College News 1916-1926
Games, Narrative, and Interaction
QGIS Workshop
Dataviz
Today’s downloads:
Today’s readings:
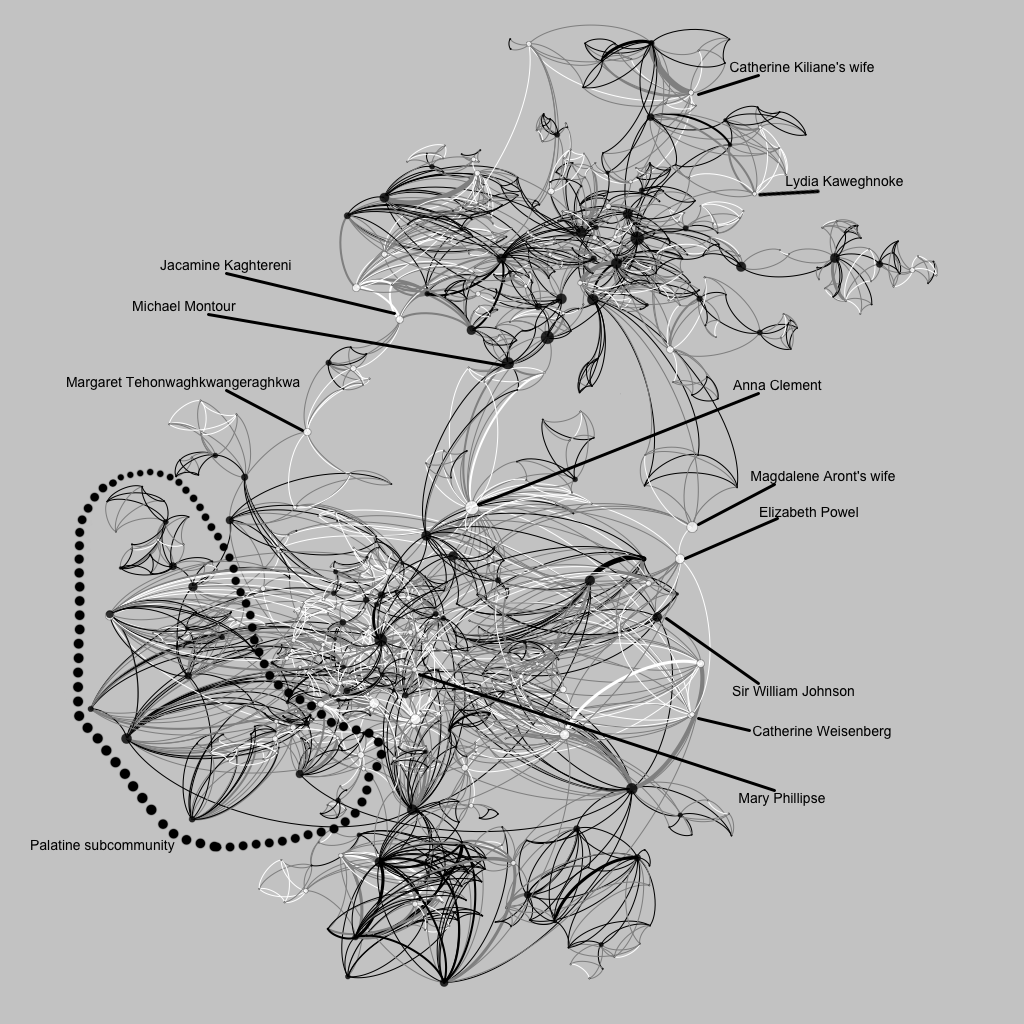
Intro to Networks


Putting Data to Work

Race and DH
Assignment: DH Project reviews
Before Tuesday’s class, choose three of the projects below and explore. You don’t need to try to see every single page or item in the project, but click around enough to get a sense of what the project is about.
- UAlbany Campus Buildings Historical Tour
- The Normal School Company & Normal School Company History
- State Street Stories
- Black and Free
- Valley of the Shadow
- Arabella Chapman Project
- Mapping Segregation
- Digital Harlem
- The Negro Traveler’s Green Book
- Visualizing Emancipation
- Cleveland Historical
- Quantifying Kissinger
- Invasion of America
- Pox Americana
- Mapping the Republic of Letters
In your comment below, discuss:
- Who is the audience for each of your projects? How can you tell? Is the audience scholarly or public? Does the project seem to engage with a historiography?
- What kind of interactivity is there? How do you as the visitor interact with the project besides just reading it? Do your projects differ in the kind of interactivity they allow?
- Does the project have an argument? How does the project use its interactivity functions to make an argument?
- How did the visual presentation of information affect your understanding of the argument, good or bad? Link a particularly great or frustrating example for at least one project.
- Did you have any frustrations in navigating or trying to interact with the project?